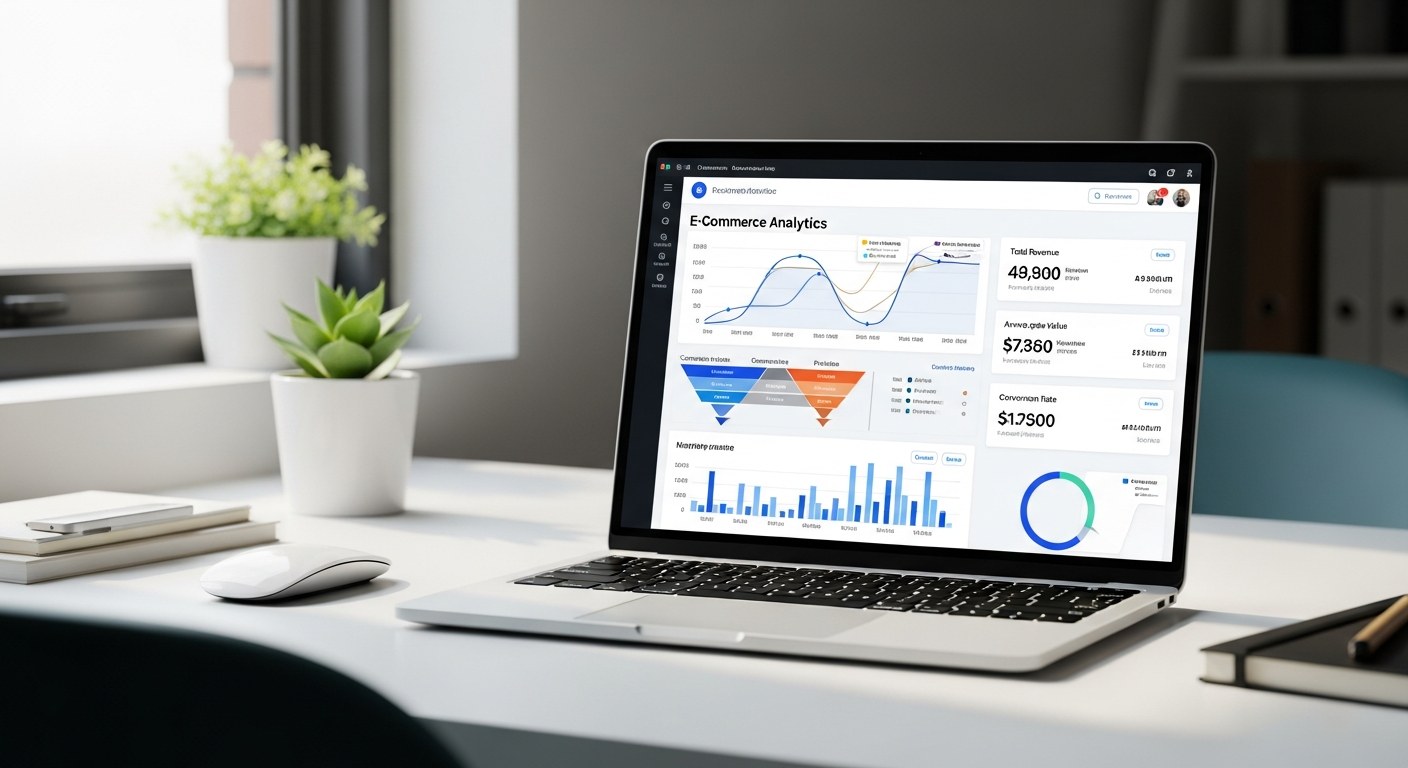
Shopify's built-in Shopify analytics contain everything you need to diagnose conversion problems, attribution gaps, and retention issues — but most merchants only look at the revenue dashboard.
The reports on returning customer rate, first-time vs. repeat cohorts, product performance by traffic source, and funnel conversion by channel are where real decisions live.
Ignoring them means flying the store on one instrument when you have a full cockpit.
Key Takeaways
- Shopify's analytics go far deeper than revenue — the reports on funnel conversion, returning customers, and product-by-channel performance are where the real intelligence lives.
- Returning Customer Rate is one of the most important retention signals in your store, and most brands never track it.
- Google Analytics 4 fills the attribution gaps Shopify can't close — connecting them is non-optional for any brand spending on paid.
- Shopify's last-click attribution model systematically undercounts channels that assist conversions (YouTube, display, social awareness).
- A 30-minute weekly data review is the single highest-leverage habit most operators never build.
Table of Contents
- The 6 Shopify Reports That Actually Matter
- How to Read Your Conversion Funnel in Shopify Analytics
- Returning Customer Rate: The Metric Most Brands Ignore
- Connecting Shopify to Google Analytics 4: Setup and Key Events
- Attribution in Shopify: What It Gets Right and Where It Lies
- Building a Weekly Data Review Habit for Your Store
- FAQ
The 6 Shopify Reports That Actually Matter
Shopify Plus merchants have access to over 60 report types. Most of them exist. Few of them matter for weekly decision-making. Here are the six that consistently drive real action.
1. Sessions by Traffic Source. This report shows where your visitors come from — organic search, paid social, email, direct — alongside sessions, conversion rate, and revenue per source.
The insight isn't volume; it's the conversion rate disparity between channels. A brand spending $15K/month on Meta ads often discovers that email converts at 4x the rate of paid social. That's a budget reallocation signal hiding in plain sight.
2. Online Store Conversion Funnel. Shopify breaks down the journey from session → product view → add to cart → checkout initiation → purchase. Each drop-off point identifies a specific problem. High add-to-cart, low checkout initiation?
Friction in your cart (shipping threshold, layout, trust signals). High checkout initiation, low purchase? Payment options, address form complexity, or a forced account creation wall.
3. Sales by Product. Not just top sellers by volume — but revenue, units, returns, and average order value by SKU. The most valuable view: products with high traffic but low conversion rate.
Those are your product page problems, not your traffic problems.
4. Returning Customer Rate. This single metric summarizes your entire retention program. Most brands track acquisition obsessively and never look here. Benchmark: a healthy DTC brand sees 25–35% of orders from returning customers.
Below 20% means you're running a leaky bucket — spending to acquire customers you can't keep.
5. Average Order Value Over Time. Trending AOV tells you whether your upsells, bundles, and cross-sells are working. A flat or declining AOV despite growing traffic means customers are buying your cheapest product and leaving.
Upsell placement, bundle offers, and threshold-based free shipping all move this number.
6. Cohort Analysis (Shopify Plus). This is the report that separates serious operators from everyone else. Cohort analysis shows, for customers acquired in a given month, how much they spent in months 1, 2, 3, 6, and 12.
It directly reveals the LTV trajectory of each customer cohort — and whether it's improving or degrading over time.
How to Read Your Conversion Funnel in Shopify Analytics
The conversion funnel report is the most direct diagnostic tool in the Shopify analytics dashboard. Here's how to read it without drawing the wrong conclusions.
Step 1: Benchmark each stage. Typical ecommerce benchmarks: sessions to product view (30–50%), product view to add-to-cart (6–12%), add-to-cart to checkout (40–60%), checkout to purchase (60–80%).
If any of your numbers are materially below these, that stage is your primary constraint.
Step 2: Segment by traffic source. A 1.2% store conversion rate is meaningless without context. Email traffic converting at 4% and paid social converting at 0.6% are very different problems that require very different solutions.
Blending them into a single number masks both the problem and the opportunity.
Step 3: Track changes over time, not just snapshots. The most useful question isn't "what is my conversion rate?" — it's "how did my conversion rate change this week compared to last?" A 15% week-over-week drop in add-to-cart rate means something changed that you need to find and reverse.
| Funnel Stage | Healthy Range | Warning Sign |
|---|---|---|
| Session → Product View | 30–50% | Below 20% |
| Product View → Add to Cart | 6–12% | Below 4% |
| Add to Cart → Checkout | 40–60% | Below 30% |
| Checkout → Purchase | 60–80% | Below 50% |
Where most brands go wrong: they see a low overall conversion rate and throw money at a redesign.
But 80% of the time the problem is one specific stage — and fixing that stage (often just improving one element like shipping display or payment options) is faster and cheaper than a full rebuild.
Returning Customer Rate: The Metric Most Brands Ignore
Returning Customer Rate (RCR) measures the percentage of orders placed by customers who have purchased from you before.
It's one of the clearest signals of whether your product delivers what you promised and whether your post-purchase experience keeps people engaged.
Why it matters more than most metrics: Every returning customer costs you roughly $0 in acquisition. Their entire order contribution is margin.
Brands with a 35% RCR are running a fundamentally different unit economics model than brands at 15% — even if their CAC and ROAS look similar on the surface.
How to improve it: The most reliable RCR drivers are post-purchase email flows (review requests, replenishment reminders, product education), loyalty programs with genuine value exchange, and SMS for time-sensitive offers to proven buyers.
Our team at Atlas consistently sees RCR improve 8–15 percentage points within 90 days when these three are implemented together on a properly segmented Klaviyo setup — for brands that had no structured post-purchase flow before.
What a declining RCR tells you: A falling returning customer rate often signals product quality issues surfacing over time, or a growing audience of one-time buyers driven by discount-heavy acquisition. It's a lagging indicator, but it's rarely wrong.
If your RCR has been dropping for three or more months, it's worth reviewing what changed in your acquisition mix and your post-purchase experience during that period.
Connecting Shopify to Google Analytics 4: Setup and Key Events
Shopify's native analytics can't answer questions about user behavior between pages — scroll depth, video engagement, button clicks, form abandonment.
Google Analytics 4 fills that gap, and it's the attribution layer that connects your Shopify store to your paid channels.
Setup basics: The cleanest integration uses Shopify's Google & YouTube channel app to install the GA4 tag sitewide and pass purchase events automatically.
This handles the basic ecommerce events (page_view, view_item, add_to_cart, begin_checkout, purchase) without custom coding. For brands running GTM (Google Tag Manager), a manual setup through the data layer gives more flexibility and event control.
The key events to verify are firing correctly:
- purchase — with transaction ID, revenue, and items array populated
- add_to_cart — triggered on button click, not page load
- begin_checkout — fires when the customer hits the checkout page
- view_item — fires on product page load with correct item data
Common setup mistake: Duplicate purchase events from both the Shopify GA4 integration and a manual GTM tag firing simultaneously. This inflates conversion counts and corrupts your conversion rate data. Verify in GA4's DebugView before going live.
Why GA4 matters for paid advertising: Meta, Google, and TikTok all read from GA4 to improve targeting models.
Accurate purchase data in GA4 — not just in each platform's native reporting — is what feeds the algorithmic optimization that keeps CPAs low. Brands skipping this setup are leaving algorithmic performance on the table every single day.
Attribution in Shopify: What It Gets Right and Where It Lies
Shopify uses last-click attribution as its default model. That means the last marketing touchpoint before a purchase gets full credit for the sale.
This model has one major flaw: it systematically undercounts channels that create intent but don't close the conversion.
What gets undercounted: YouTube ads, Meta awareness campaigns, display retargeting, podcast sponsorships, and organic social all drive meaningful purchase intent — but users often convert through a direct visit or Google search after being exposed.
In last-click models, that final organic or direct visit gets all the credit, and the awareness channel gets none.
What gets overcounted: Branded search gets credited for conversions that were already determined before the customer even picked up their phone.
If someone sees your Meta ad, gets convinced, and then Googles your brand name to buy — Meta drove that sale. But Shopify will credit "organic search."
How to get a more accurate picture:
- Use GA4's data-driven attribution model, which distributes credit across the full path
- Compare platform-reported ROAS against Shopify's revenue figures — the gap reveals how much each channel is assisting
- Run incrementality tests on channels you're considering cutting; last-click models often make them look unprofitable when they're not
| Attribution Model | Best Use | Limitation |
|---|---|---|
| Last-click (Shopify default) | Simple, direct channels | Undercredits awareness/upper funnel |
| First-click | Measuring acquisition drivers | Ignores post-awareness nurturing |
| Data-driven (GA4) | Multi-touch full-funnel view | Requires 50+ conversions/month |
| Linear | Balanced full-funnel credit | Less actionable for optimization |
The honest answer is that no single attribution model tells the whole story. The brands making good media decisions use 2–3 models together and treat attribution as a hypothesis, not a verdict.
Building a Weekly Data Review Habit for Your Store
The operators who compound results fastest aren't doing more analysis — they're doing it more consistently. A 30-minute weekly data review, structured the same way every time, is worth more than an occasional three-hour deep dive.
The weekly review framework:
Monday (15 min): Prior week recap. Total revenue vs. prior week, prior year. Conversion rate by traffic source — look for anomalies. Top 5 SKUs by revenue and units. Any new returns spike worth investigating.
Wednesday (10 min): Paid media check. Compare platform-reported spend vs. GA4 revenue by channel. Check ad frequency (Meta) and impression share (Google) for saturation signals. Review any new creative tests started last week — enough data yet to read?
Friday (5 min): Email performance. Revenue from email in the prior 7 days. Returning customer rate vs. prior period. Any flows triggered by unusual events (a big sale, viral post) worth capturing and replicating.
Document your findings. The goal isn't to read the numbers — it's to act on them. Keep a running log of weekly observations and the changes you made. Over 12 weeks, patterns emerge that you'd never catch from monthly reviews.
A brand that consistently identifies one conversion bottleneck per week and addresses it compounds faster than one running occasional audits and hoping for insight.
Our CRO and Shopify development work at Atlas always starts with analytics setup — because you can't optimize what you're not measuring accurately.
If your Shopify analytics aren't giving you clear action signals, the data infrastructure itself usually needs attention before any other growth work makes sense.
Frequently Asked Questions
What is the most important report in Shopify Analytics for store owners?
The Online Store Conversion Funnel is the highest-leverage report for most store owners. It directly shows where in the purchase journey customers are dropping off — sessions to product views, add to cart, checkout initiation, and purchase.
Each stage that falls below benchmark is a specific, actionable problem. Most stores have one or two stages that are significantly underperforming the rest, and fixing those moves the overall conversion rate more than any amount of traffic spend.
How do I set up Google Analytics 4 with my Shopify store?
The simplest path is through Shopify's built-in Google & YouTube channel, which installs the GA4 tag and configures standard ecommerce events automatically.
After connecting, verify in GA4's DebugView that purchase events are firing with accurate revenue and item data before running paid traffic.
If you're using Google Tag Manager, the manual setup via Shopify's data layer gives more granular control over custom events and is worth the extra setup time for brands spending over $10K/month on paid ads.
What is a good conversion rate for a Shopify store?
The industry average across all Shopify stores is 1.2–1.5%, but this number is nearly meaningless without segmenting by traffic source. Email traffic typically converts at 3–6%, while paid social averages 0.5–1.5% depending on the vertical.
The more useful question is how your conversion rate compares by channel, and how it's trending week over week. A brand with a 1.0% overall conversion rate growing consistently every week is in a much better position than one at 2.5% and declining.
How does Shopify attribution work and why doesn't it match my Meta or Google data?
Shopify uses last-click attribution — the final touchpoint before purchase gets full credit. Meta and Google use their own attribution windows (often 7-day click, 1-day view by default), which frequently overlap on the same conversion.
This causes the sum of reported revenue across platforms to exceed your actual Shopify revenue. The gap is normal; it reflects different models measuring the same purchases through different lenses.
GA4's data-driven model gives the most balanced view for multi-channel brands.
What does Returning Customer Rate tell me about my store?
Returning Customer Rate measures what percentage of orders come from customers who have purchased before. It's the primary indicator of how well your post-purchase experience drives repeat buying.
A healthy DTC brand sees 25–35% of orders from returning customers. If yours is below 20%, you're likely lacking post-purchase email flows, a loyalty mechanism, or both.
It's also the leading indicator of LTV — brands with higher Returning Customer Rate almost always have stronger 12-month lifetime value per customer.
Ready to Build a Store Worth Measuring?
Analytics give you visibility. What you do with that visibility determines results. If your current setup is giving you data but not answers, let's take a look.
Talk to the Atlas Team →